
A command-line utility for real-time monitoring of Slurm HPC node statuses, CPU/Memory/GPU utilization, and partition jobs. Built to address an operational challenge: standard Slurm commands like sinfo and squeue provide dense text output, making it difficult for cluster administrators and users to quickly visualize resource pressure and GPU allocation across nodes.
What it does #
The tool queries Slurm for nodes in a target partition, formats resource allocations using visual progress bars, and categorizes node states and active workloads.
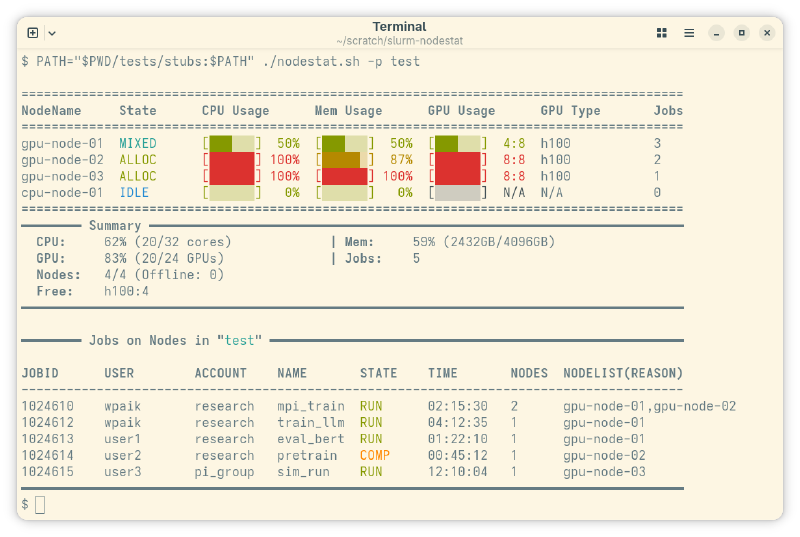
Visual resource bars replace raw numeric ratios with visual progress bars ([██████] 100%) for CPU and Memory, and exact device allocation counts ([███░░░] 2:4) for GPUs.
State color-coding highlights node states for immediate identification (ALLOC in green, MIXED in cyan, IDLE in blue, CG in orange, and DRAIN/DOWN in red).
GRES type extraction reads whatever type name the node advertises instead of matching a hardcoded model list, with a fallback for untyped gpu:N configurations. The allocation regex captures only the device count, so metadata blocks like (IDX:0-3) never reach the formatter. Non-GPU nodes render a dimmed N/A.
Node-scoped job accounting counts jobs by hardware, not by submission partition. A private lab partition usually overlaps a shared one, so a job submitted to gpu can occupy a mylab node without appearing in squeue -p mylab. The per-node column counts every job holding that node, including completing (CG) jobs; the summary counts distinct jobs, so a four-node MPI job contributes 1 rather than 4.
Partition Configuration #
The behavior for public vs. non-public partitions is driven by a simple array at the top of the script:
# Modify to match your cluster's public partitions
public_partition=("cpu" "gpu")
Partitions not listed here are treated as private and get the job table.
Why it was built #
Managing Slurm partitions requires monitoring resource usage without running complex web-based monitoring stacks. Standard commands like sinfo -N provide unstructured text that makes identifying mixed or drained nodes slow. Parsing heterogeneous GPU allocations manually from GRES strings is error-prone. This tool was built to provide an immediate, zero-dependency Terminal UI (TUI) for quick checks directly from login nodes.
Two decisions shaped the implementation. Counting jobs per node and summing them multiplies every multi-node MPI job by its node count, so the summary needed a separate distinct-job query. And since the tool runs on a login node, scheduler load matters: a batched job lookup using scontrol show hostnames was prototyped and rejected, because on partitions where job count exceeds node count it costs more than the per-node queries it replaces.
Sample output #
Partition inspection #
Plain-text version
========================================================================================
NodeName     State      CPU Usage      Mem Usage      GPU Usage      GPU Type       Jobs
========================================================================================
gpu-node-01  MIXED      [███░░░]  50%  [███░░░]  50%  [███░░░]  4:8  h100           3
gpu-node-02  ALLOC      [██████] 100%  [█████░]  87%  [██████]  8:8  h100           2
gpu-node-03  ALLOC      [██████] 100%  [██████] 100%  [██████]  8:8  h100           1
cpu-node-01  IDLE       [░░░░░░]   0%  [░░░░░░]   0%  [░░░░░░]  N/A  N/A            0
========================================================================================
━━━━━━━━ Summary ━━━━━━━━━━━━━━━━━━━━━━━━━━━━━━━━━━━━━━━━━━━━━━━━━━━━━━━━━━━━━━━━━━━━━━━
  CPU:     62% (20/32 cores)             | Mem:     59% (2432GB/4096GB)
  GPU:     83% (20/24 GPUs)              | Jobs:    5
  Nodes:   4/4 (Offline: 0)
  Free:    h100:4
━━━━━━━━━━━━━━━━━━━━━━━━━━━━━━━━━━━━━━━━━━━━━━━━━━━━━━━━━━━━━━━━━━━━━━━━━━━━━━━━━━━━━━━━

━━━━━━━━ Jobs on Nodes in "test" ━━━━━━━━━━━━━━━━━━━━━━━━━━━━━━━━━━━━━━━━━━━━━━━━━━━━━━━

JOBID      USER        ACCOUNT    NAME       STATE    TIME       NODES  NODELIST(REASON)
----------------------------------------------------------------------------------------
1024610    wpaik       research   mpi_train  RUN      02:15:30   2      gpu-node-01,gpu-node-02
1024612    wpaik       research   train_llm  RUN      04:12:35   1      gpu-node-01
1024613    user1       research   eval_bert  RUN      01:22:10   1      gpu-node-01
1024614    user2       research   pretrain   COMP     00:45:12   1      gpu-node-02
1024615    user3       pi_group   sim_run    RUN      12:10:04   1      gpu-node-03
━━━━━━━━━━━━━━━━━━━━━━━━━━━━━━━━━━━━━━━━━━━━━━━━━━━━━━━━━━━━━━━━━━━━━━━━━━━━━━━━━━━━━━━━
Technical details #
- Language: Bash 4+
- Scheduler integration: Slurm (
sinfo,squeue) - Formatting: ANSI 256 colors, Unicode block progress bars, fixed-width
printfpadding with escape sequences kept outside width specifiers - Parsing: Native Bash regex for GRES/TRES strings; read-based tokenization with no external process per node
- Dependencies: Standard coreutils, no external runtime libraries
- Target platform: Linux HPC clusters running Slurm Workload Manager